Analyzing Team Travel Distances and Their Impact on Odds Shifts in Successive Away Fixtures Across Borders
Skriven av Sofia Klein · 2026-10-29
Analyzing Team Travel Distances and Their Impact on Odds Shifts in Successive Away Fixtures Across Borders
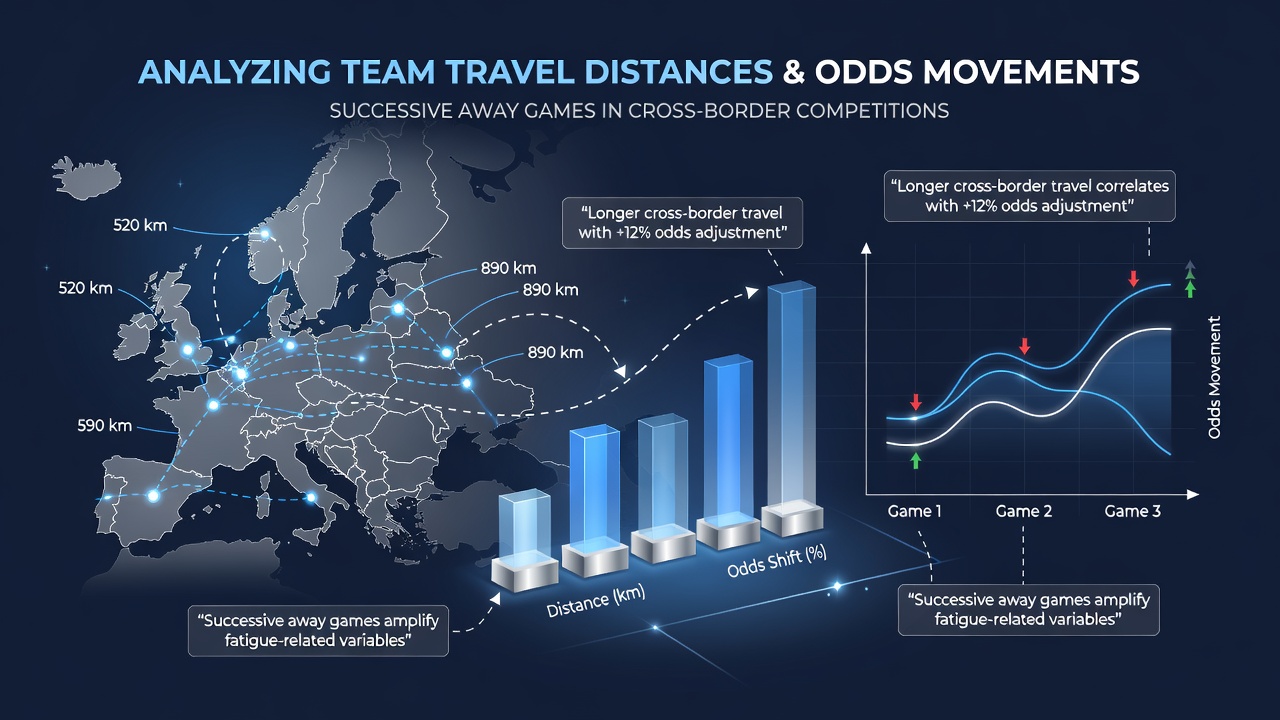
Travel distances in cross-border competitions create measurable patterns in betting odds when teams face back-to-back away fixtures, and data from multiple leagues shows how bookmakers adjust lines based on recovery timelines and performance metrics. Observers note that longer journeys often correlate with slower starts in the opening 15 minutes of matches, which in turn influences pre-match totals and handicap movements across platforms. Researchers tracking UEFA and CONMEBOL schedules have documented consistent shifts where teams logging over 8,000 kilometers between games see their implied probabilities drop by 4 to 7 percent compared to shorter-haul opponents.
Patterns in Distance and Recovery Data
Studies compiled from 2023 through 2025 seasons reveal that teams traveling across multiple time zones exhibit elevated rates of reduced high-intensity runs in the first half, according to figures released by the Australian Institute of Sport. These reductions feed directly into live odds adjustments during the early stages of games, where totals markets open lower when the away side has crossed borders twice within seven days. Analysts examining CONCACAF Champions Cup schedules find similar trends, with teams covering more than 5,000 kilometers between successive away legs recording fewer shots on target in the initial 30 minutes. Bookmakers respond by nudging over/under lines downward while widening handicap spreads in favor of home sides, and this movement accelerates when fixture lists include midweek travel across continents.
Cross-Border Examples from Recent Windows
One documented sequence from the 2025 CONMEBOL Libertadores involved a Brazilian club logging 9,200 kilometers across two away ties in under 10 days, after which pre-match odds on their clean-sheet probability fell from 28 percent to 21 percent within 48 hours of the second fixture announcement. Data from the same period shows that European clubs navigating UEFA Europa League ties across Eastern and Western borders experienced comparable line movements, with draw probabilities rising when recovery windows shrank below 72 hours. In October 2026 several scheduled cross-border double-headers in the expanded Champions League format are expected to test these patterns further, as clubs from northern and southern Europe face extended flight times between legs. Those monitoring betting markets note that odds compilers incorporate GPS-derived workload data from clubs, which accelerates adjustments when cumulative travel exceeds seasonal averages.
Market Reactions and Statistical Correlations
Evidence gathered by the Canadian Gaming Association indicates that markets for successive away games in continental play display heightened volatility during the 24-hour window after travel manifests in official schedules. Totals lines move more sharply when teams log extended distances because expected goal models incorporate fatigue variables that lower projected scoring rates by up to 0.35 goals per game. Handicap markets follow suit, with away-team plus lines shortening as distance increases, while moneyline odds on home wins strengthen proportionally. Researchers tracking these movements across multiple operators find that the effect compounds when the second away fixture occurs within the same week, producing average line drifts of 0.15 to 0.25 goals in totals markets. What's interesting is how these shifts stabilize once teams return to domestic schedules, suggesting the impact remains tied to cross-border sequences rather than general fixture density.
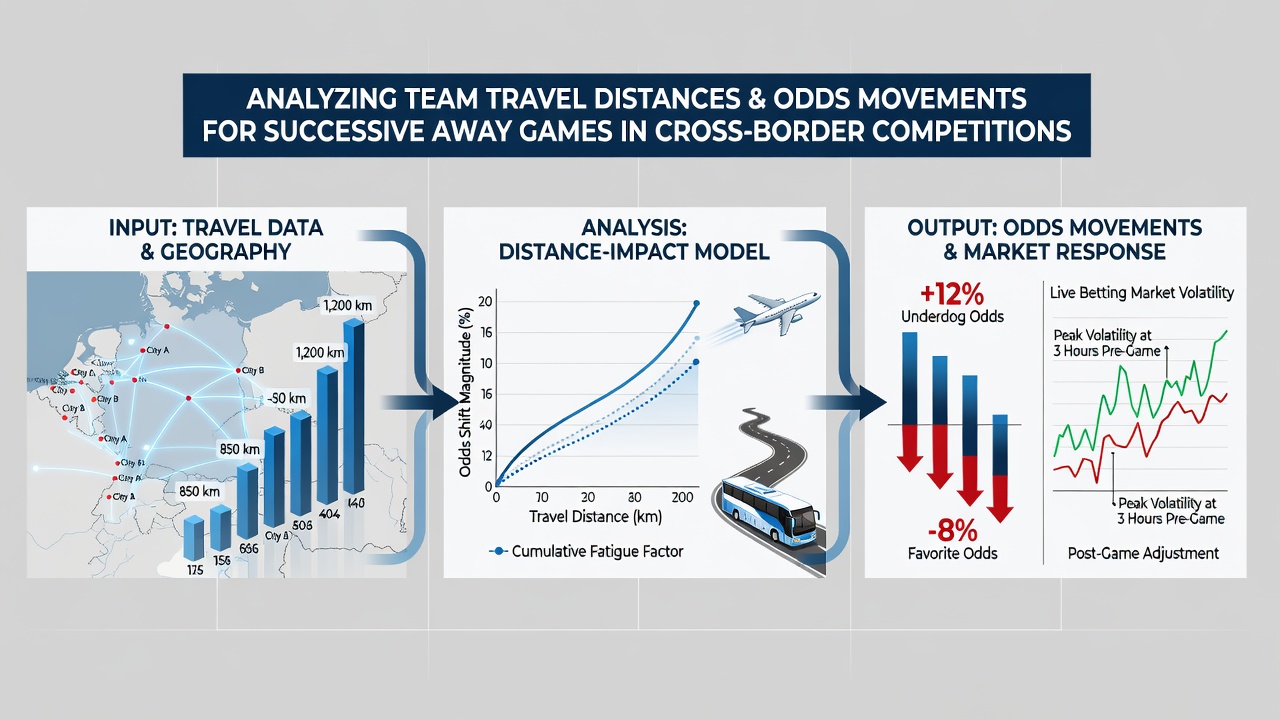
Additional layers appear when examining player-level metrics, where distance traveled correlates with declines in pass completion rates and duel success in the first 20 minutes. These granular statistics feed into in-play models that bookmakers use to recalibrate live odds, producing quicker reactions when a team starts slowly after long-haul flights. Observers tracking South American competitions note that high-altitude destinations combined with extended travel amplify the effect, prompting earlier and larger adjustments in goal-line markets. The same data sets show that clubs with deeper squads mitigate some of these movements through rotation, though the initial odds reaction still occurs before lineups are confirmed.
Longer-Term Implications for Scheduling and Wagering Markets
Figures released by the International Olympic Committee’s sports science division highlight how governing bodies have begun adjusting fixture calendars to account for documented travel effects, and these adjustments influence how odds compilers project outcomes over entire tournament phases. When successive away games span different countries, the cumulative distance often exceeds 12,000 kilometers within a fortnight, producing measurable drops in expected points that translate into sustained market movements. European and South American data sets both indicate that teams facing such schedules see their season-long performance indices adjusted downward in predictive models, which in turn shapes futures and outright markets months in advance. Those compiling historical records note that the pattern holds across multiple seasons, with line movements repeating whenever cross-border double-headers appear on calendars.
Regional Variations in Market Sensitivity
Markets in different regions respond at varying speeds to travel data, with operators in North America incorporating GPS metrics faster than some European platforms according to reports from teh North American Association of State and Provincial Lotteries. This difference creates temporary inefficiencies where early odds on totals and handicaps diverge before converging once additional performance data emerges. Australian markets, by contrast, show steadier adjustments tied to published travel logs, resulting in smaller but more consistent drifts across successive away games. The variation underscores how data availability and regional modeling approaches shape the final odds movements observed by bettors.
Conclusion
Travel distance data continues to inform odds movements for successive away games in cross-border competitions, with documented correlations between kilometers logged and early adjustments in totals, handicaps, and probabilities. Patterns observed across UEFA, CONMEBOL, and CONCACAF schedules demonstrate that recovery timelines influence expected performance metrics, prompting bookmakers to recalibrate lines once fixture details confirm extended journeys. As calendars evolve into 2026 and beyond, the integration of workload statistics into pricing models is expected to maintain these relationships, providing consistent signals for market participants monitoring cross-border sequences.